
Overview:
Students examine patterns in direct and diffuse radiation. Students compare generation from the solar panels to the absolute insolation. Students perform a cost benefit analysis for a home energy system
Investigations with Solar Data lesson
Essential Question
How can we precisely measure the amount of solar radiation that is available for solar generation?
NGSS Standards:
| Standard Number | Standard text |
| 4-PS3-2 | Make observations to provide evidence that energy can be transferred from place to place by sound, light, heat, and electric currents. |
| HS-ESS2-4 | Use a model to describe how variations in the flow of energy into and out of Earth’s systems result in changes in climate. |
| HS-PS4-5. | Communicate technical information about how some technological devices use the principles of wave behavior and wave interactions with matter to transmit and capture information and energy. |
| SEP | Analyzing and interpreting data |
- What does a Seattle Solar year look like in detail?
- Over what time period to we collect 80% of the energy available for a year?
- What angle is best?
- What is the efficiency of commercial solar panels under real conditions?
Research Connection:
Scientists and engineers are trying to make more efficient solar panels. Measuring performance under real conditions of varying light, clouds, temperature and atmospheric conditions will help them optimize their materials and systems. The energy from a whole panel is often less than what was predicted under optimal lab conditions.
Background
Solar radiation is one of the most accessible forms of renewable energy. 173,000 terawatts of solar energy strikes the earth continuously– more than 10,000 times humanity’s current energy usage! This makes solar panel technology one of the most exciting areas in renewable energy.
In order to maximize energy generation, solar cells and panels are designed to be as efficient as possible. When solar panel designs are made or changed, they are most often tested in the laboratory with an “artificial sun”– a broad-spectrum light carefully calibrated to match the sun’s spectrum as closely as possible. One advantage of this approach is that it makes it easy to compare outputs and efficiencies of different designs. However, controlled laboratory data doesn’t necessarily tell you how devices perform in natural conditions, where they will be put to use. Shifting sun angles, cloud cover, haze, dust and other environmental factors can all affect solar panel performance. Solar panel efficiency also decreases with panel temperature, which is associated with irradiance and other environmental factors and is often higher in the real world than in a controlled laboratory setting.
UW SOLAR TEST BED
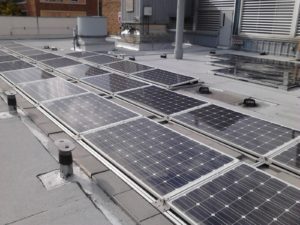
The UW solar panel test bed offers an excellent opportunity to do some analysis with actual solar panel field data. The facility consists of three solar panel arrays of different types, made of thin film, monocrystalline and polycrystalline silicon. These arrays have areas of 21.6 m^2, 21.775 m^2, and 21.775 m^2, respectively. The facility collects data on how much energy each array generates at fifteen-minute intervals (note that the data is on energy generation, measured in watt-hours, rather than power).
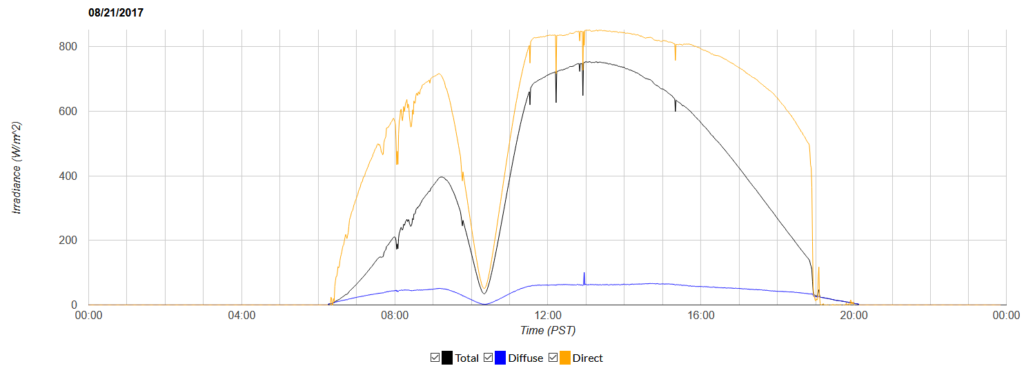
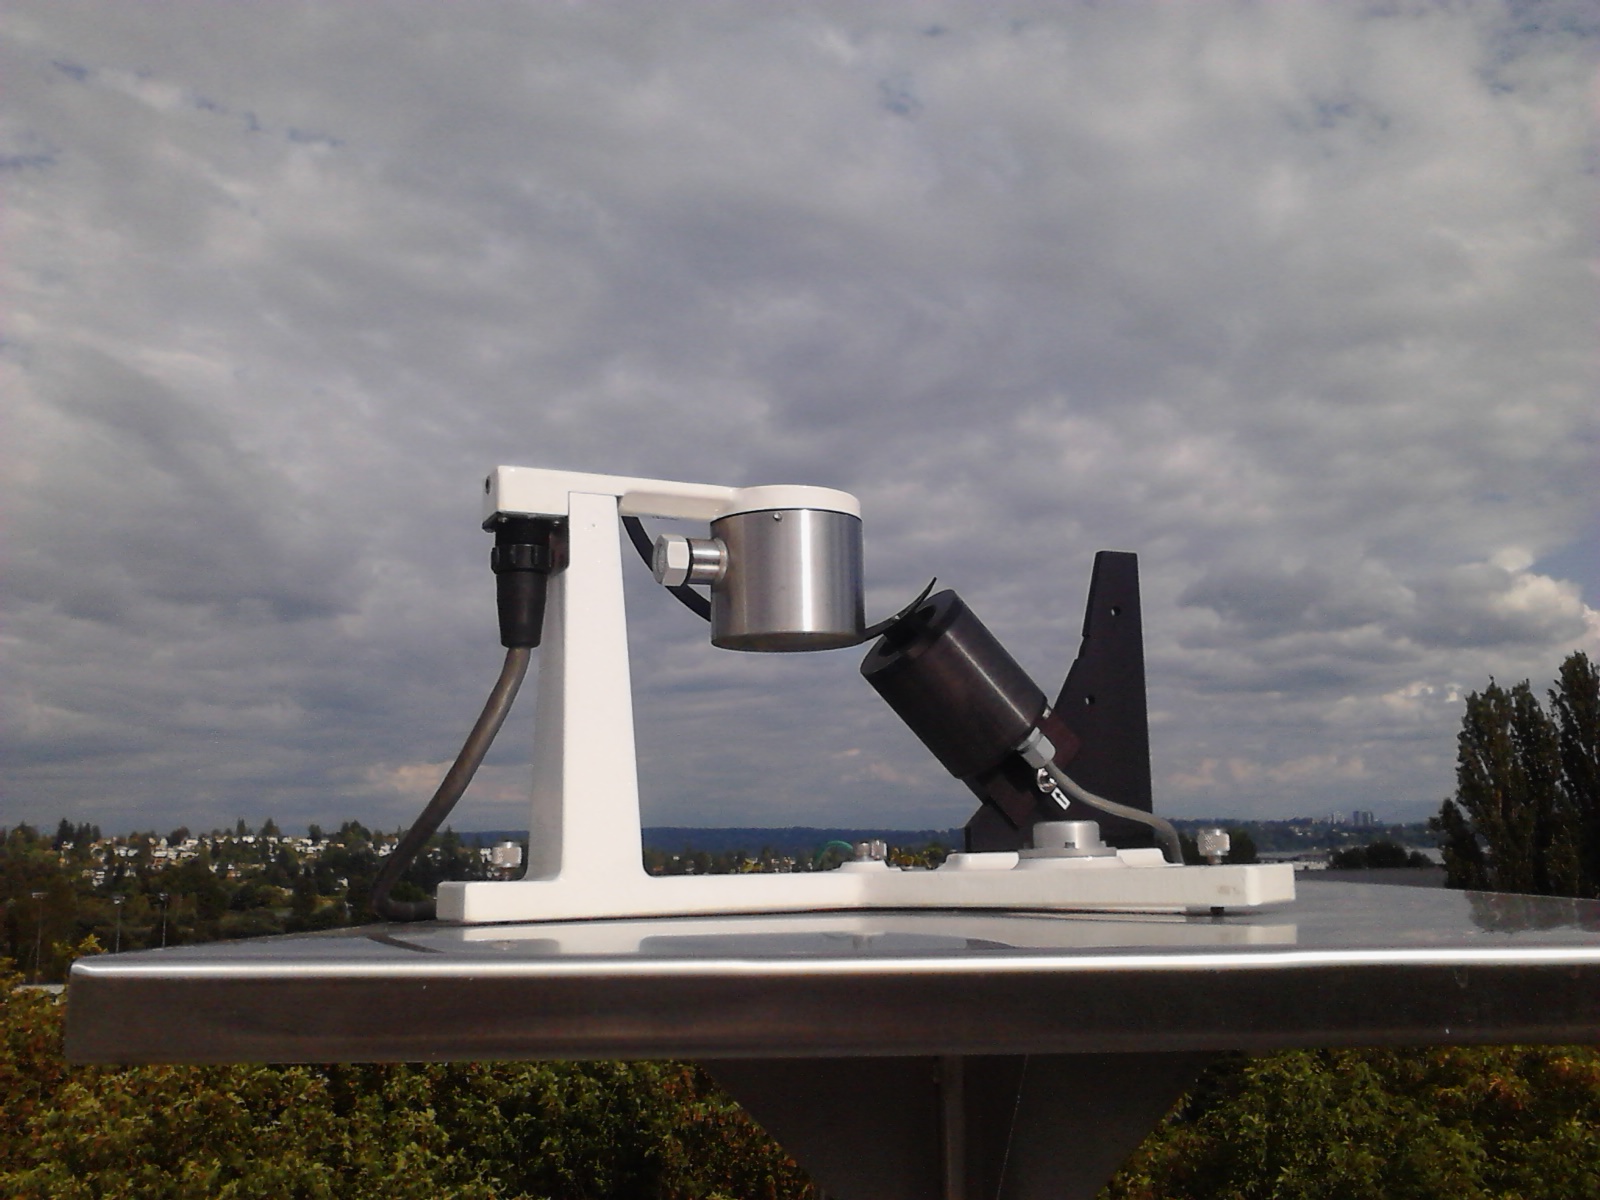
Adjacent to the panels is a radiometer, which measures irradiance from different sources. The UW radiometer measures the total, direct and diffuse irradiance at a range of wavelengths. The diffuse irradiance is the amount of irradiance received from the sky and atmosphere (including weather formations), while the direct irradiance refers only to the insolation, or the irradiance coming directly from the sun. The total irradiance is the sum of these two measurements, and is the measurement of all of the irradiance that the radiometer can detect.
REQUIREMENTS: Algebra 2, Beginning Excel Proficiency
LESSON VOCABULARY:
- Energy: Energy is a physical quantity which corresponds to the ability to do work. Energy can take many forms, including mechanical, chemical, thermal and radiant energy. One Joule is the preferred unit of energy for physicists, although it is often measured using units of calories, kilowatt-hours or BTUs, depending on the context.
- Power: Power is defined as an amount of energy per unit of time, and is typically measured in Watts, or one Joule per second. For example, a 100-Watt lightbulb uses energy at a rate of 100 Joules every second.
- Kilowatt-hour: Another unit of energy, a kilowatt-hour (or kwH) is defined as the amount of energy supplied by a constant power of 1000 watts (one kilowatt) in one hour. Most discussions of solar energy involve this unit, so it is important to remember the formula:
Kilowatt-hours = Watts x Time (in hours) x 3600 / 1000
- Irradiance: Irradiance is the amount of radiant energy (energy from light and radiation) that reaches a given area over some unit of time. Recall that energy divided by time is power, so this is equivalent to the amount of power going through a given area. Irradiance is usually measured in Watts/meters2. Solar irradiance, or insolation, is the amount of solar power that reaches a given area. For example, if the insolation on a perfectly efficient solar panel with an area of 1 meter2 was 20 Watts/meters2, then that panel would be able to produce 20 Watts of power.
- Solar Cell Efficiency: The ratio of the output wattage of a solar panel to the total solar power (insolation times area). Alternately, efficiency can be computed by taking the ratio of a panel’s energy generation to the total available solar energy over an interval of time.
- Solar Zenith Angle: The angle between the sun and the normal line at any one location. The normal line is an imaginary line that extends straight up, or is perpendicular to the ground. Ideally, the insolation at a location is proportional to the cosine of the zenith angle (though external and environmental factors make this not always the case). For a more detailed explanation of solar zenith angle, go to this link:
https://www.pveducation.org/pvcdrom/properties-of-sunlight/elevation-angle
https://glasnost.itcarlow.ie/~powerk/GeneralGraphicsNotes/LightingShadingandColour/lighting.html
https://www.e-education.psu.edu/eme810/node/506
- Direct Irradiance: Irradiance coming directly from the sun. The normalized direct irradiance is the direct irradiance divided by the cosine of the zenith angle. This measurement is useful because it tells us how much power a solar panel could be getting if it was tilted at a certain angle.
- Diffuse Irradiance: Irradiance received indirectly, from sources like the sky, clouds, and other atmospheric and environmental factors. Atmospheric scattering is the process by which the sun’s light is scattered by molecules and particulates in the atmosphere, and is responsible for most diffuse irradiance. Atmospheric scattering is the reason why the sky appears blue during sunny days and red at sunsets.
Procedure:
Investigation 1: Reading and Interpreting Radiometer Data
Objective: Students will be able to examine radiometer data and understand the relationship between diffuse and total irradiance. Students will generate hypotheses about atmospheric phenomena and make qualitative assessments of the weather on the basis of the data.
Materials:
- 3-7-2015 Data.xlsx
- 3-22-2015 Data.xlsx
Description: Before we start looking at panel efficiencies, it is important to understand the ways that the energy from the sun gets down to earth for the solar panels to use. For this, we can look at the UW solar test bed radiometer, which measures the total, diffuse and direct irradiances at fifteen-minute intervals throughout the day. In addition, it is able to parse the incoming radiation and determine the irradiances at 414, 496, 613, 670, 869, and 937 nanometer wavelength light. We see 414 nm as a shade of violet, 496 nm as a light shade of blue, 613 nm as a shade of orange and 670 a shade of red. 869 nm and 937 nm are invisible to the naked eye, and are classified as near-infrared radiation. By comparing the levels of diffuse irradiance and total irradiance for each wavelength, we can get information about the way that the atmosphere is scattering the sun’s incoming radiation.
Directions:
- Open the 3-7-2015 Worksheet.xlsx file. Plot the graphs of the total irradiance and diffuse irradiance for all wavelengths of light. Use these to answer questions 1-3.
- Find the median of each ratio of diffuse to total irradiance. Graph the ratio over time for each wavelength using a scatter or line plot. Use these to answer questions 4 and 5.
- Plot the median values for total and scattering against the wavelengths for 7:00 am to 7:00 pm.
- Repeat this process for the 3-22-2015 Worksheet.xlsx file.
Questions
- What is the shape of the graph of the direct irradiance? Why do you think it has this shape?
- Rank each wavelength according to its levels of direct irradiance.
- Rank each wavelength according to its diffuse irradiance. For which wavelength(s) have these rankings changed? Why do you think this is?
- What times of day is there more scattering? What time is there the least? Why do you think this is?
- What is the average percentage of the incoming solar irradiance that has been scattered? Why do you think it varies for each wavelength?
- Based on your results, what do you think the weather was like on each date? Why?
Excel Challenge:
- With the data for March 7, investigate the relationship between the scattering and the cosine of the zenith angle. Is it directly proportional? Inversely proportional? Does it vary by wavelength? Why do you think that you observe these relationships?
Investigation 2: Comparing Generation to Insolation
Objective: Students will be able to understand the relationship between insolation and energy generation in solar panels, and will be able to determine solar panel efficiencies on the basis of this data.
Materials:
- 3-7-2015 Data.xlsx
- 3-22-2015 Data.xlsx
- Complete radiometer data archive https://www.cei.washington.edu/radiometer/graph.html?
- Panel production data http://dashboard.mckinstry.com/uw/ requires siliverlight plugin and IE.
Description: Now that you have some background with the radiometer data, we can look at how well the solar panels are performing under different conditions. The monocrystalline panels are 1.68 sq meters x 13 panels = 21.8 square meters of collecting area.
Directions:
- Open the Panel Data worksheet for March 7th.
- Plot the graphs of the efficiency and generation over time for each panel type. Use these to answer question 1.
- Calculate the actual generation for each panel type by summing the energy generation for the entire day. Use this to answer question 2.
- Answer question 3, then repeat this process for the March_22_Mashup.xlsx worksheet. Use your results to answer question 4.
- Pull up the industrial specifications for each solar panel type at the link https://www.cei.washington.edu/education/uw-solar-spectrum-projects/uw-power-plant-roof-solar-arrays/ . Use this to answer question 5.
- Compile your observations into a short report. Discuss the performance of each panel type under certain conditions. Was your initial answer to question 4 correct? Make sure to compare your live results with the laboratory results.
- You can generate data for any day using the UW energy Dashboard panel data (select “Solar” and the three 1350_PP data sets on the left, and the data range in the lower right), and the radiometer data archive for that day (Select the data for the day and select “cumaltive kWH” for the y axis.) This will tell you how many kWH per square meter that were available for the entire day. Multiply this by the area of the panel to get the total energy available for that area. Divide generated into the available to get the efficiency.

Questions:
- Compare the graphs for generation and efficiency for each panel type. What do you notice about their shapes? Which ones are more efficient? Which ones are less?
- Compute the total generation and find the average efficiency for each panel over the course of the day. How do these results compare to your results for questions 2 and 3?
- How do you think the panel performance will compare under different weather conditions? Why?
- Were the panels more efficient under the overcast conditions or the sunnier conditions? By how much or how little? Do your results vary between panel types?
- Compare your results with the laboratory tests. Are there differences?
Excel Challenge:
- Look at the weather history for the University of Washington at the link http://www.wunderground.com/history/zipcode/98122/2014/6/7/DailyHistory.html?cm_ven=TWC&cm_ite=History and identify three more dates with clear, sunny conditions, and three more dates with bad weather conditions. Use the data on the ‘Full Solar Data.xlsx’ spreadsheet to repeat the above process with these dates. Are your results the same? Different? What do you notice?
Investigation 3- Solar Panel Cost/Benefit Analysis
Objective: Students will understand the ways that solar panels can contribute to household energy supply through a mock cost-benefit analysis of three solar panel types.
Materials:
- Full Solar Data Images
Background:
Now you can apply the techniques and knowledge you have learned to make real-world choices about solar panels. In this scenario, you are the head of a typical Seattle household, and you are considering adding solar panels to your roof. You have 50 square meters of available roof space for this project. You are choosing between the three panel types being tested at the UW test bed, and need to make an educated decision about how to wisely spend your money. You are interested in sustainability, but are also concerned with getting a positive return on your investment.
Directions:
- Estimate your yearly total energy consumption by using statistics from the links below or other trustworthy sources. Then identify at least four significant household appliances/activities and estimate how much energy each one consumes in a year. Use statistics from the links below to estimate your electric bill for a year and the contributions from each of your appliances/activities.
- With the industrial panel specifications and statistics on cost/watt, estimate the cost of each panel per square meter.
- Go to the solar panel data sheets and find the cumulative energy generation for the year for each panel type. Calculate the generation per square meter for each type. Calculate the amount of energy that the panels would generate in one year if you used them to cover most of your roof (assume it is flat).
- Prepare a report about your choice of panel. In it, you must:
- Specify the cost of covering your roof space with each panel type.
- Give an estimation of the time it would take for you to achieve a complete recoup on your investment for each solar panel.
- Give a graph of the panel generations for each day of the year. Explain what contributions each panel array would make to your total energy consumption (which activities it could power) and when.
- Explain your reasoning behind your decision. Which factors were most important to your decision? Where did you make compromises?
Resources:
Investigations with SolarData lesson
- Household activities and appliances power consumption: https://www.cse.org.uk/advice/advice-and-support/how-much-electricity-am-i-using
- Estimating the energy consumption of household activities and appliances: http://energy.gov/energysaver/articles/estimating-appliance-and-home-electronic-energy-use
- Estimating the energy cost: http://www.bls.gov/regions/west/news-release/averageenergyprices_seattle.htm
- Estimating the cost per watt:
- PVWatts Calculator from NREL
- Directions for building a homemade pyranometer
- UW Energy Dashboard http://dashboard.mckinstry.com/uw/ requires IE and silverlight
Download 3-7-2015 Data
Download 3-22-2015 Data
Download Solar Radiometer Macro Mashup with Macros
 |
 |
Complete Radiometer Data Interface
Below is a live feed of today’s solar radiation measurements.
What’s Happening?
Can you explain the graph below recorded on August 21st 2017?