

Overview
In this lab you will measure the current versus voltage for several photovoltaic cells using computer probeware. The cells are tested under varying resistance loads and varying light levels.
Essential Question
How can you compare the efficiency of two solar cells and determine the peak power?
Background
Solar cells produce different voltages and currents depending on the light levels and resistance in the circuit. How can you tell what the peak power of solar cell is? This is the method that researcher use to measure and compare the power from various solar cells. It uses a simple technique with computer probeware to measure the current/voltage curve of a solar cell in order to determine its peak power. It allows you compare various types of cells and shows how difficult it is to get an accurate absolute measurement of performance. Researchers build test cells using different materials and techniques and then test them in a controlled way. A common test is to create a voltage current plot. The curve goes between the open circuit voltage (Voc) and the short circuit current Jsc. If you measure the voltage of solar cell with no load, that is  the open circuit. The maximum voltage occurs when there is no resistance and no current. If you have an infinite resistance on the circuit there is no voltage but a maximum current. Somewhere between these extremes is the peak power, a combination of current times voltage which can be seen as the elbow on the voltage current curve. In this experiment a variable resistor is used to obtain a series of voltage and current pairs. The resulting curve is a measure of the overall performance of the cell. The fill factor is the degree to which the J/V curve approximates the ideal which would be a straight line going horizontal with constant current to the VOC where the current drops to zero. Researchers usually use computers to collect and analyze PV performance data. The Pasco voltage/current probe connected to the USB link provides an easily visible display of solar cell performance.
NGSS Standards
| HS-PS3-1. | Create a computational model to calculate the change in the energy of one component in a system when the change in energy of the other component(s) and energy flows in and out of the system are known. |
| HS-PS3-3. | Design, build, and refine a device that works within given constraints to convert one form of energy into another form of energy.* |
Materials
- Current Voltage Probe (Pasco, part#: PS-2115)
- Probe software (from Pasco, either Datastudio, Sparkvue, or Capstone)
- Probe USB link interface (Pasco, part#: PS-3200 or Vernier Go!Link USB interface)
- 0-1K ohm (precision- 10 turn) variable resistor
- Computer
- Different types of solar cells (Pitsco and Electronics Goldmine both sell solar cells)
- 1 crystalline silicon solar cell (c-Si)
- 1 amorphous silicon solar cell (a-Si)
- 1 copper indium gallinide diselenide solar cell (CIGS)
- Sunlight or halogen spotlight incandescent light source
Procedure
To set up the experiment follow these directions:
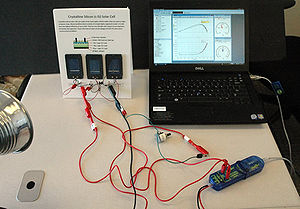
- Set up a solar cell at a set distance from a light source or in full sun. Be sure to keep illumination constant through the measurements. (If you are using a halogen spotlight be careful about overheating the plastic enclosure of the solar cell- keep it at least 24” away). Depending on the light level it may be necessary to connect three solar cells in series to bring the voltage into a useful range.
- Connect the voltage probe to output of the solar cell using the black lead to the negative, red to positive.
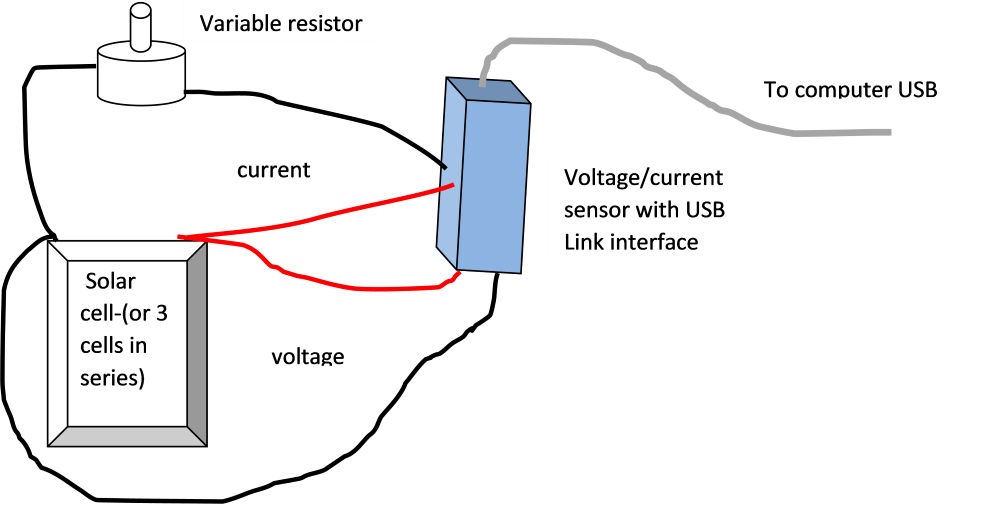
- Connect the current probe to the output of the solar cell in series with the 500 ohm variable resistor. The resistor will be used to decrease the current from Jsc (where there is maximum current but no voltage since it is essentially a short circuit), to a maximum resistance Voc at which time there is no current flowing through the resistor but maximum voltage. Variable resistors will have to be carefully chosen; 0-100, 0-500, 0-1000 are possibilities. The convention in JV curves is to show photocurrent as negative.
- Open the DataStudio activity called JVcurve.ds. It will display a graph with power on the y and volts on the x, a second graph with amps on the y axis and volts on the x, and dial displays for current and voltage. The sampling option is set to “Manual Sampling” and “Keep data values only when commanded. On both meters and graph the appropriate range is 0-.1 amps for current and 0-1.5 volts.
- Click “Start” to begin viewing the current and voltage. The “Start” button turns to “Keep” with a red stop square to the right. Each time you click “Keep” a data point is added to the graph at the instantaneous current and voltage levels. This data set is known as a “run” and is noted in the data summary area on the left with a matching icon on the graph. (An alternative method is to set the sampling method to timed and then steadily change the potentiometer to fill points along the curve. Since this is continually collecting x-y points it can result in a large number of redundant pairs but is more immediate as a dynamic display).

- Adjust the variable resistor from 0 ohms to full resistance in a series of steps. You’ll notice that as the resistance increases the voltage increases and the current decreases.
Carefully adjust the variable resistor so that you get readings every .05 volts. - Click the red square to stop data collection. Click “start” to begin a new data set.
- Repeat this measurement with different solar cell types.
- Repeat this measurement for with different levels of illumination for example by moving the lamp
- Establish the resistance which sets voltage and current for the point of peak power for the given light conditions. Under these conditions apply different colored filters, such as red, green, and blue. Record the wavelength of the transmitted light (which should be recorded on the filter) and the power.
| Filter transmission wavelength (nm) | Current (J) milliamps | Voltage (V) | Power (JxV) milliwatts |
Lab Report
Create a Standard Lab Report with the following sections.
- Introduction
- Materials
- Methods
- Data
- Results and analysis
In the results section answer these questions.
- Identify the Jsc, Voc, and peak power for each type of cell.
- Label the area of the graph that is considered the “fill factor”.
- What effect did changing the level of illumination have on your graph?
- Based on your results which the solar cells has the best efficiency?
- Graph the action spectrum for each solar cell. What differences do you detect?
Resources
PV Characterization Lab lesson
https://www.cei.washington.edu/education/uw-solar-spectrum-projects/ Live insolation data for Seattle
https://www.nrel.gov/research/re-solar.html
http://www.nrel.gov/midc/unlv/ live insolation data for Las Vegas
http://en.wikipedia.org/wiki/Solar_cell
https://youtu.be/aVe4rRGq4p4 pv characterization video